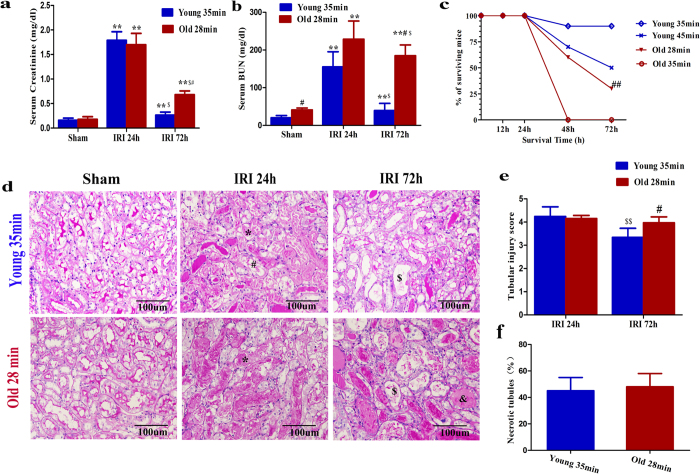
Figure 1. Survival and renal function of young mice that underwent 35 min of IRI and of old mice that underwent 28 min of IRI.
(a,b) Serum creatinine (a) and BUN values (b) at 24 h and 72 h for young mice that underwent 35 min of IRI and for old mice that underwent 28 min of IRI. (c) Survival curves for young mice after 35 min or 45 min of IRI and old mice after 28 min or 35 min of IRI. (d,e) Renal histology (d) and tubular injury scores (e) at 24 h and 72 h of young mice that underwent 35 min of IRI and old mice that underwent 28 min of IRI. (f) The percentage of necrotic tubules at 24 h of young mice that underwent 35 min of IRI and old mice that underwent 28 min of IRI. For serum creatinine (a) and BUN (b), values are means ± SD, n = 6–8 in each group. **P < 0.01 vs. sham, #P < 0.05 vs. young mice with 35 min of IRI, $P < 0.05 vs. 24 h after IRI. For survival curves (c), ##P < 0.01 vs. young mice with 35 min of IRI by log-rank, n = 10 in young mice, 35 min of IRI, n = 20 in old mice, 28 min of IRI. For renal histology (d), original magnification, 400 × . *Indicates necrotic tubules, #indicates loss of brush borders &indicates tubule dilatation, and $indicates cast formation. For tubular injury scores (e) and necrotic tubules (f), values are means ± SD. Approximately 40 HPFs (magnification, 400 × ) per individual mouse (10 HPFs per slide, four slides per animal) were evaluated; n = 6 in each group. #P < 0.05 vs. young mice with 35 min of IRI, $$P < 0.01 vs. 24 h after IRI.

