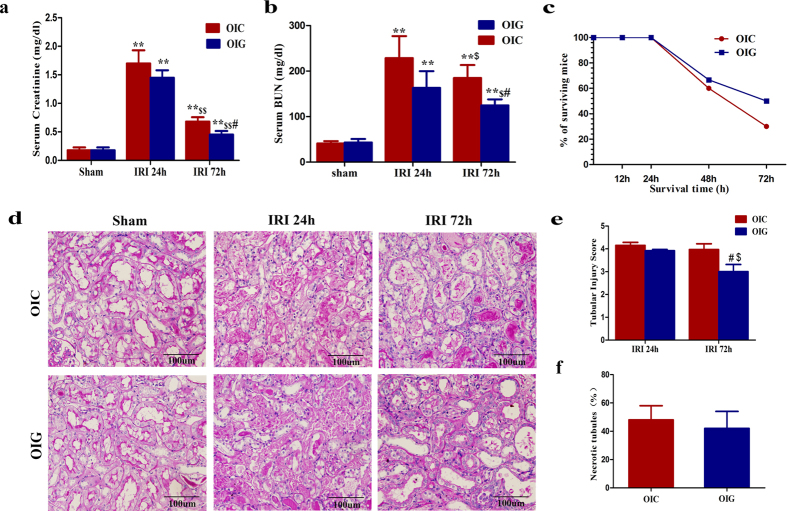
Figure 4. GDF11 increased the survival, renal function, and renal repair of old mice that underwent 28 min of IRI.
(a,b) Serum creatinine (a) and BUN levels (b) at 24 h and 72 h for old mice that underwent 28 min of IRI in the control and GDF11 groups. (c) Survival curves at 72 h for old mice that underwent 28 min of IRI in the control and GDF11 groups. (d,e) Renal histology (d) and tubular injury scores (e) at 24 h and 72 h of old mice that underwent 28 min of IRI in the control and GDF11 groups (original magnification, 400×). (f) The percentage of necrotic tubules at 24 h of old mice that underwent 28 min of IRI in the control and GDF11 groups. For serum creatinine (a) and BUN (b), values are means ± SD, n = 6 in each group. OIC, old mice that underwent IRI in the control group; OIG, old mice that underwent IRI in the GDF11 group; **P < 0.01 vs. sham, #P < 0.05 vs. OIG, $P < 0.05 vs. 24 h after IRI, $$P < 0.01 vs. 24 h after IRI. For survival curves (c), OIC, old mice that underwent IRI in the control group; OIG, old mice that underwent IRI in the GDF11 group; P > 0.05 by the log-rank test, n = 20 in OIC, n = 12 in OIG. For tubular injury scores (e) and necrotic tubules (f), values are means ± SD. Approximately 40 HPFs (magnification, 400×) per individual mouse (10 HPFs per slide, four slides per animal) were evaluated. Values are means ± SD, n = 5–6 in each group. OIC, old mice that underwent IRI in the control group; OIG, old mice that underwent IRI in the GDF11 group; #P < 0.05 vs. OIC, $P < 0.05 vs. 24 h after IRI.

