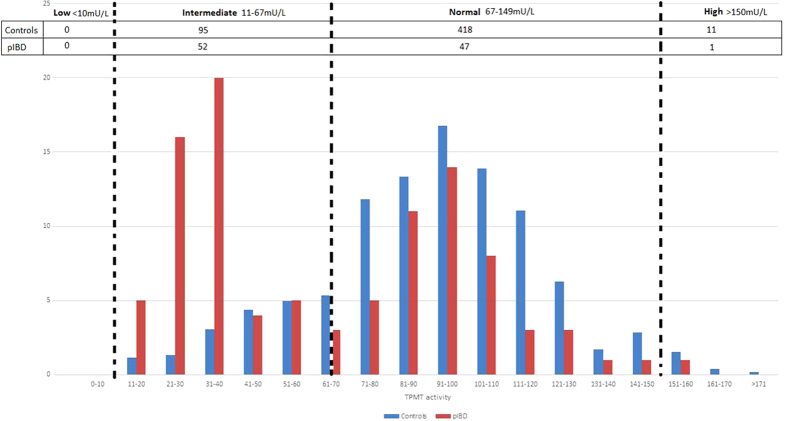
Figure 2. TPMT phenotype frequency distribution for the Wessex paediatric population and the research cohort.
Figure shows the TPMT phenotype frequency distribution for 524 paediatric patients, in the Wessex region (524 patients ≤ 18 years, between Dec 2010–April 2015, includes patients with/without IBD) and the TPMT phenotype distribution in our research cohort. Within our cohort we observe a statistically significant difference between the sub-category with TPMT values between 21–40 units (p = 0.001) compared to the Wessex paediatric population. This difference is not observed between the sub-categories with TPMT values between 41 to161 (p = 0.90)

