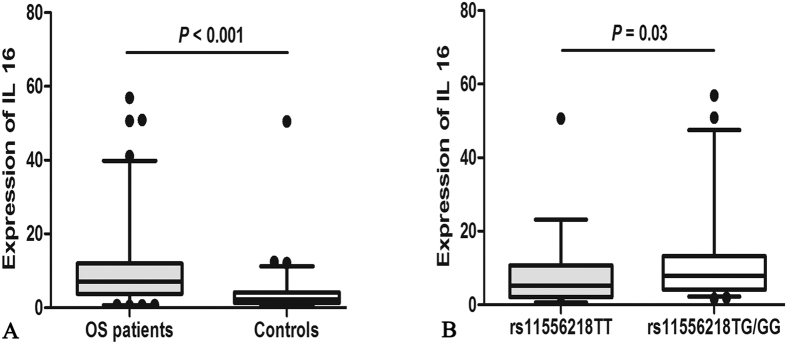
Figure 1. ELISA detection of IL16 expression.
(A) plasma level of IL16 in osteosarcoma patients (n = 82) and controls (n = 68). (B) plasma level of IL16 in patients carrying rs11556218 TG/GG genotypes (n = 46) and patients carrying TT genotype (n = 36). The lines inside the boxes denote the medians. The boxes denote the interval between the 25th and 75th percentiles. The whiskers denote the interval between the 5th and 95th percentiles.

