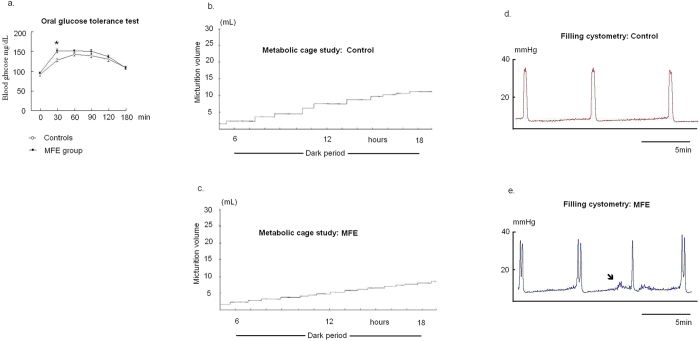
Figure 1. The phenotype of MFE offspring in insulin resistance and voiding behavior.
(a) OGTT test: the response curve of plasma glucose to OGTT test at the age of 12-week of experimental animals. Points represent mean ± SE of 12 observations. Asterisk indicates significant difference between controls and MFE rats (t-test, p = 0.005). (b,c) Metabolic cage study: a MFE rat showed the increased micturition frequency. (d,e) Filling cystometry: The shorten ICIs of cystometry characterized bladder overactivity in MFE rats. The non-void contractions were observed in some MFE rats (arrow).

