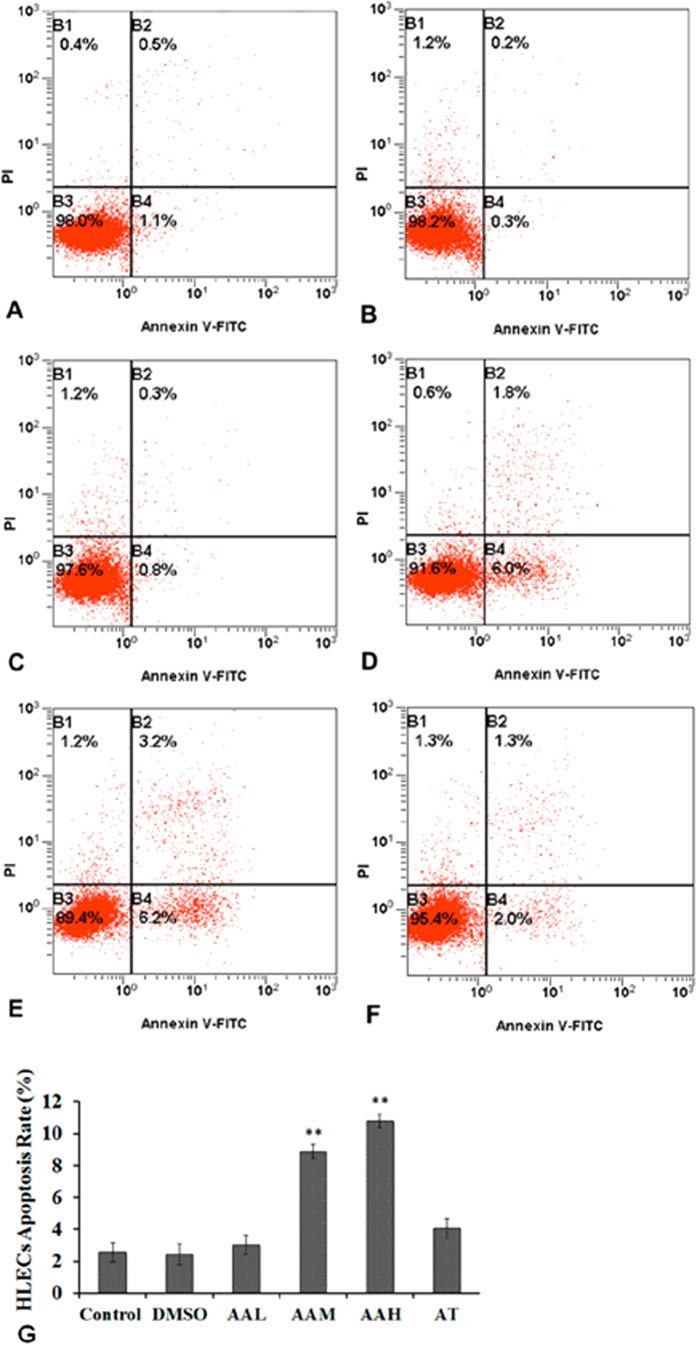
Figure 7. Flow cytometry analyses of HLEC apoptosis induced by AA after being cultured for 48 hours.
The cell apoptosis rate increased remarkably in the AAM and AAH groups. The apoptosis rate of the A+T group did not different significantly from that of the control group. (A) control group; (B) DMSO group; (C) AAL group; (D) AAM group; (E) AAH group; (F) AT group.

