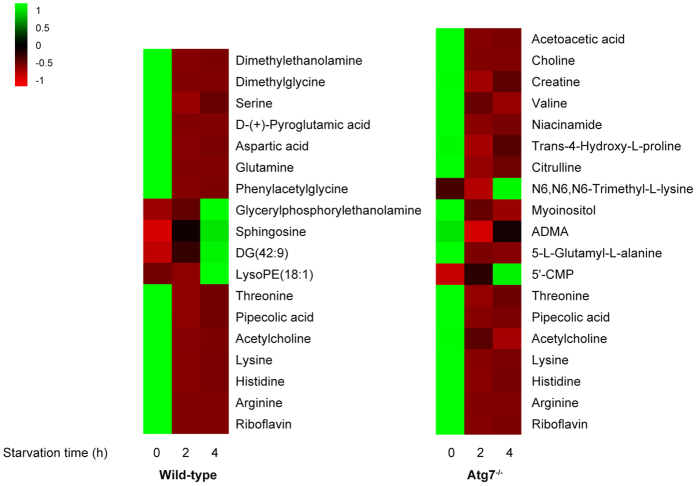
Figure 3. Heat maps denoting the fold change of the altered metabolites in wild-type MEFs and Atg7−/− MEFs.
Columns correspond to cell groups under different starvation time, and rows correspond to different altered metabolites. Shades of green represent elevated levels of content, while shades of red represent reduced levels of content.

