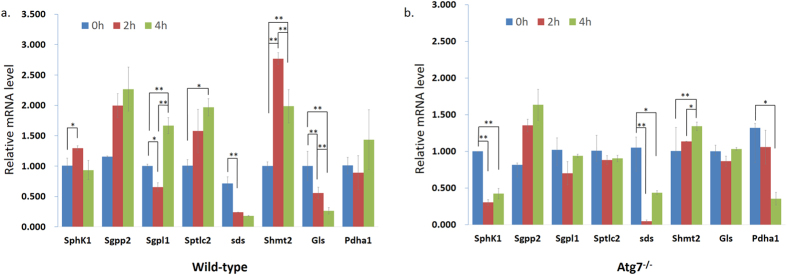
Figure 6. Expression of related proteins along with the starvation time.
(a) The related enzymes mRNA expression in wild-type MEFs and (b) the related enzymes mRNA expression in Atg7−/− MEFs under different starvation time. RNA was extracted and analyzed by quantitative PCR. Cells were treated with EBSS for the indicated times. Error bars indicate the SD (n = 3). *p < 0.05; **p < 0.01.

