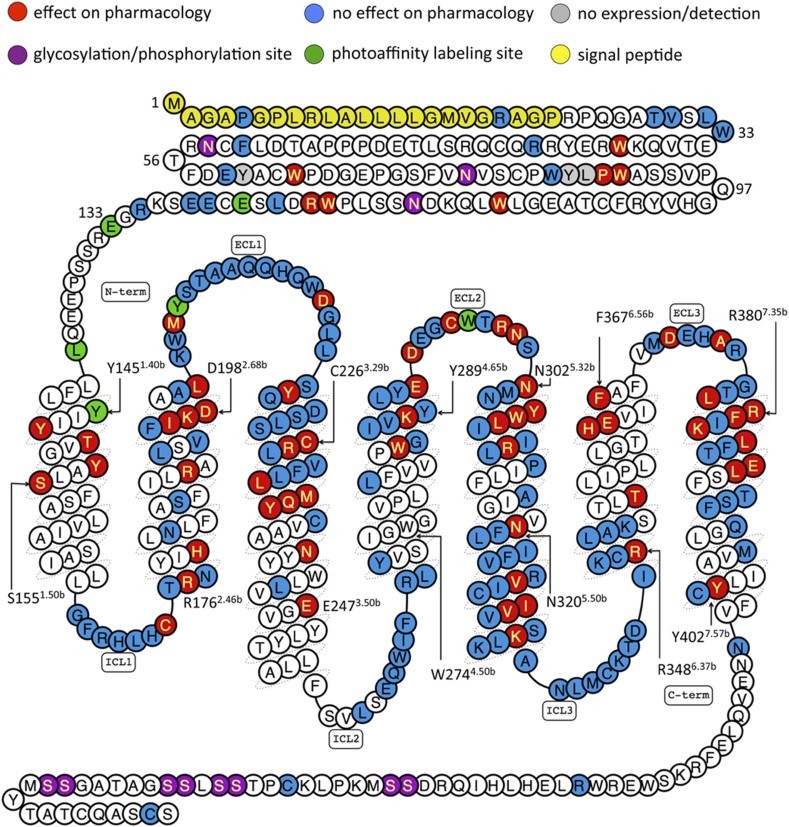
Fig. 3.
Summary of GLP-1R mutagenesis. A snake plot of GLP-1R from http://www.gpcrdb.org that has been colored (see Key) to highlight the location of signal peptide, glycosylation, and phosphorylation sites, as well as the mutated residues in Table 1. It should be noted that the color coding of 74 of the 195 mutated residues (W39, W72, W87, W91, W110, F169-C174, R176, N177, H180, N182, A200-Q213, W214-G225, R227-F230, L232, M233, E262-L268, F321-I332, K334-K336, and R348-K351) reflects the effects of rat GLP-1R mutations projected on the hGLP-1R amino acid sequence. The color coding of 27 of the 185 residues (K202, W203, S206-Q211, Q213, W214, G216-Q221, S223-G225, R227-F230, L332, M233, I325, and F326) reflects the effect of double mutations, not single-point mutations. Information on the fold change in ligand affinity and potency as well as expression levels of the GLP-1R mutants is reported in Table 1.

