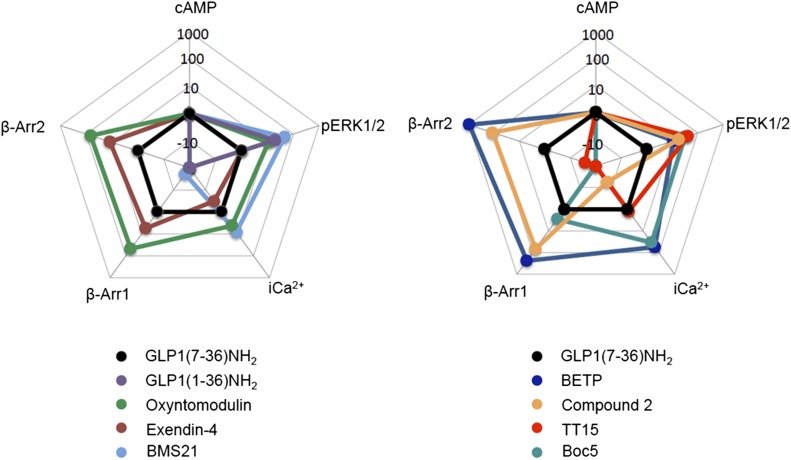
Fig. 5.
Web of bias illustrating distinctions in the pattern of signaling of different peptide agonists (left panel) or nonpeptidic modulators (right panel) at GLP-1R. The web of bias plots ΔΔτ/KA values on a logarithmic scale for each ligand and for every signaling pathway tested. Formation of these values included normalization to the reference ligand GLP-17–36 amide and the reference pathway, cAMP accumulation. The plots do not provide information on absolute potency, but on relative efficacy for signaling of individual pathways in comparison with that for cAMP. Data are from Koole et al., 2010; Willard et al., 2012a; and Wootten et al., 2013b.

