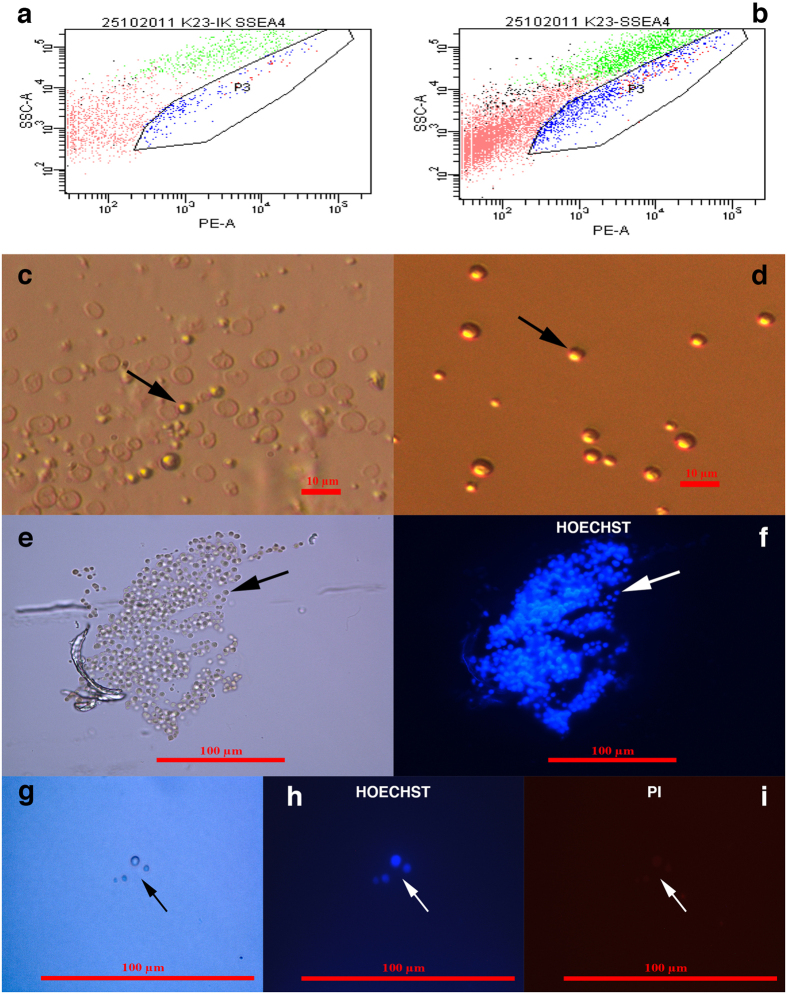
Figure 7. FACS sorting of small putative stem cells from healthy ovaries and their Hoechst 33258 and propidium iodide (PI) staining.
(a) Dot plot of FACS-isotype control (IK); (b) Dot plot of FACS-sample; (c) Small putative stem cells (arrow) in enzymatically digested ovarian tissue; (d,e) Small putative stem cells (arrows) sorted from “healthy” ovarian tissue; (f) Blue nuclei filling almost the entire cell volumes of the small putative stem cells stained by Hoechst 33258; (g) Small putative stem cells observed under a light microscope (magnification 1000x) (arrow), (h) the nuclei of small putative stem cells stained blue by Hoechst 33258 (arrow), and (i) viable small putative stem cells that did not stain red by propidium iodide (PI) staining. Scale bar, 10 μm (c,d), 100 μm (e–i).

