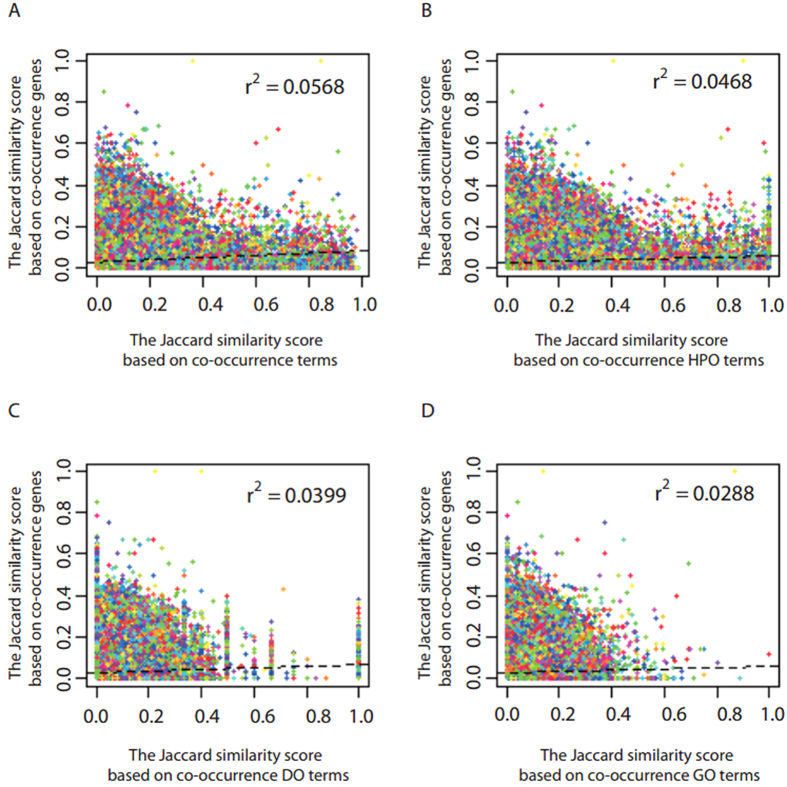
Figure 3. Performance evaluation of OAHG by gene similarity.
(A) The distribution of the similarity of genes based on ontologies. (B) The distribution of the similarity of DO terms based on HPO. (C) The distribution of the similarity of genes based on DO. (D) The distribution of the similarity of genes based on GO.

