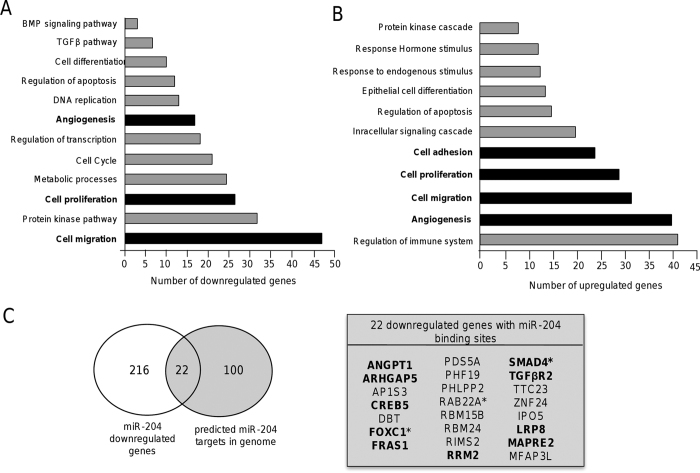
Figure 6. Classification of genes modulated by miR-204.
The pathways and biological processes analysis using gene ontology terms is shown. (A) Downregulated and, (B) upregulated genes. Cellular processes of particular interest in the present study are denoted in bold. (C) Venn diagram comparing the number of genes modulated by miR-204 overexpression (white circle) and predicted as miR-204 targets (grey circle) by TargetScan and Pic-tar programs. Circles intersection indicates the 22 genes identified in both analyses. Genes related to cell proliferation, migration and angiogenesis are in bold. Previously validated targets of miR-204 are indicated with asterisks.

