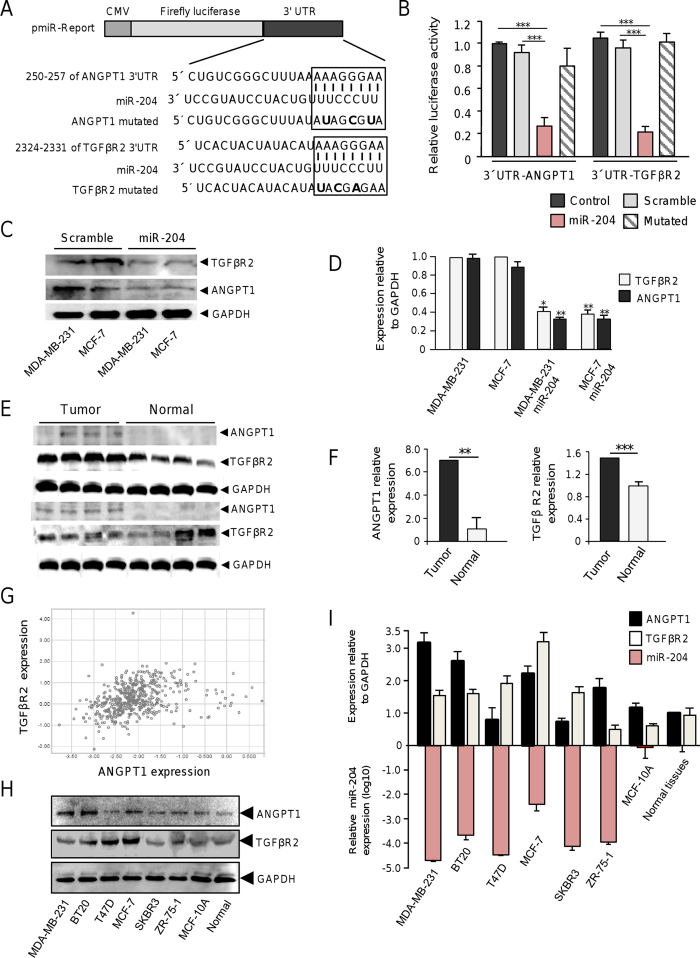
Figure 7. MiR-204 targets ANGPT1 and TGFβR2.
(A) Schematic representation of p-miR report constructs containing the 3′UTR of ANGPT1 and TGFβR2 genes cloned downstream of luciferase gene. Seed sequences are indicated in boxes. Point mutations in the miR-204 binding sites of 3′UTR of ANGPT1 or TGFβR2 genes are denoted in bold. (B) Luciferase assays in MDA-MB-231 cells transfected with miR-204 and the constructs described in A. Cells transfected with p-miR report plasmid alone or not transfected were used as controls. Data represent the mean ± S.D. of three independent experiments. (C) Western blot of MDA-MB-231 and MCF-7 cells, non-transfected and transfected with pre-miR-204, using ANGPT1 (1:1000) and TGFβR2 (1:1000) primary antibodies. GAPDH antibodies were used as control. (D) Densitometric analysis of bands in panel C. Data were normalized using GAPDH expression. Images are representative of three independent experiments. (E) Western blots of two representative sets of breast tumors and non-tumoral tissues using ANGPT1 (1:1000) and TGFβR2 (1:1000) antibodies. GAPDH antibodies were used as control. Data were normalized using GAPDH expression. (F) Densitometric analysis of immunodetected bands in panel E. (G) Comparison of ANGPT1 and TGFβR2 expression in breast cancer using dataset from TCGA. (H) Western blot assays for ANGPT1 and TGFβR2 in breast cancer cell lines and normal tissues. (I) Densitometric analysis of immunodetected bands in H (upper bars), and miR-204 expression levels in the same breast cancer cell lines (bottom bars). Protein expression data were normalized using GAPDH. Data for miR-204 expression were normalized using RNU44. Bars are representative of three independent experiments ± S.D.

