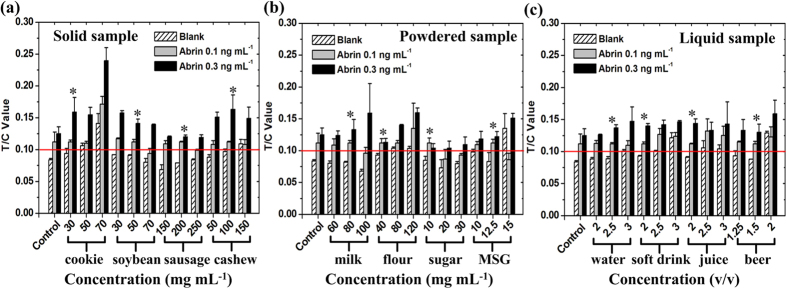
Figure 5. Performances of the abrin-UPT-LFA in detecting abrin in various spiked food samples.
The x-axis refers to the different concentrations or volume ratios used for sample preparation, and the y-axis refers to the detection results (repeated three times) for abrin in samples using the abrin-UPT-LFA. Standard abrin solutions with no food matrices were used as the controls. *MST of each sample. Data are represented as mean ± s.d., n = 3.

