
Figure 3. Comparison of receivers operating characteristic (ROC) curves showing the classification performance of nQi (main contribution of this paper), alternating finger tapping and single key tapping on the combined dataset of 42 PD subjects and 43 controls.
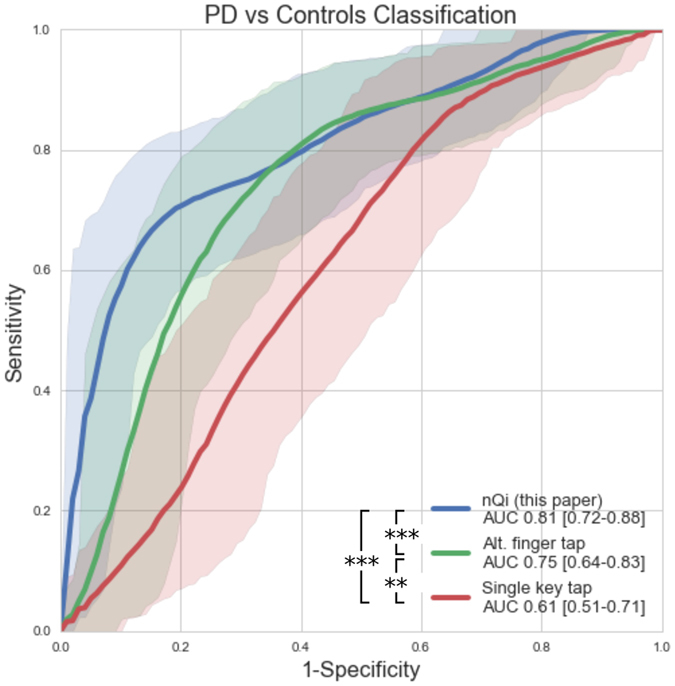
The shadowed areas represent the 95% confidence intervals. In the legend, the area under the ROC curve (AUC) and the 95% confidence intervals and are shown (see Table 1 for more details). The nQi score shows the best performance in comparison with alternating finger tapping (p < 0.001) and single key tapping (p < 0.001). Alternating finger tapping and single key tapping are two quantitative measurements commonly used to evaluate motor impairment in PD studies. In our cohort, the former showed better performance than the latter (p = 0.008). The p-values have been computed with the DeLong’s test for correlated ROC curves, which test the null hypothesis that the AUCs of two ROC curves are statistically the same.