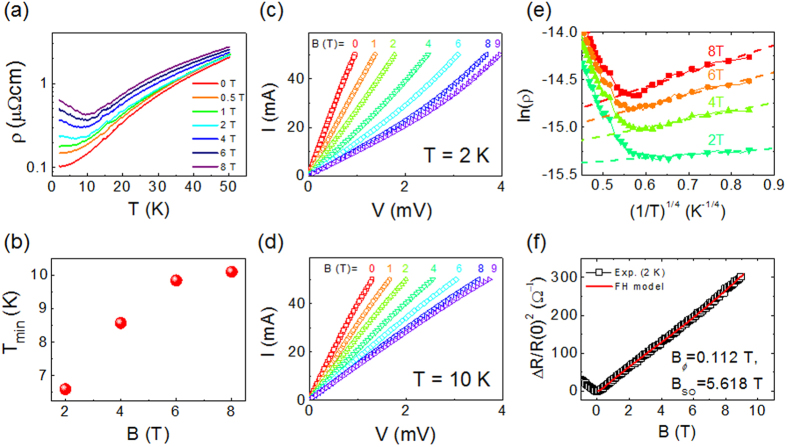
Figure 3.
(a) Resistivity (ρ) of a 65 nm-thick Sr(Nb0.2Ti0.8)O3 film as a function of temperature (T) with varying magnetic field (B), (b) Temperature at the resistance minimum (Tmin) as a function of B, (c,d) the current (I)-voltage (V) characteristic curve with varying B at 2 K and 10 K, respectively. (e) ln(ρ) vs. (1/T)1/4 curves under various magnetic field. Solid lines are linear fitting to each curve below the Tmin. (f) ΔR/R(0)2 as a function of B at 2 K (replotted from Fig. 2(b)). A red solid line is the fitting curve by Fukuyama-Hoshino model (see the text) with the fitting parameters, Bϕ = 0.112 T and BSO = 5.618 T.

