
Figure 4.
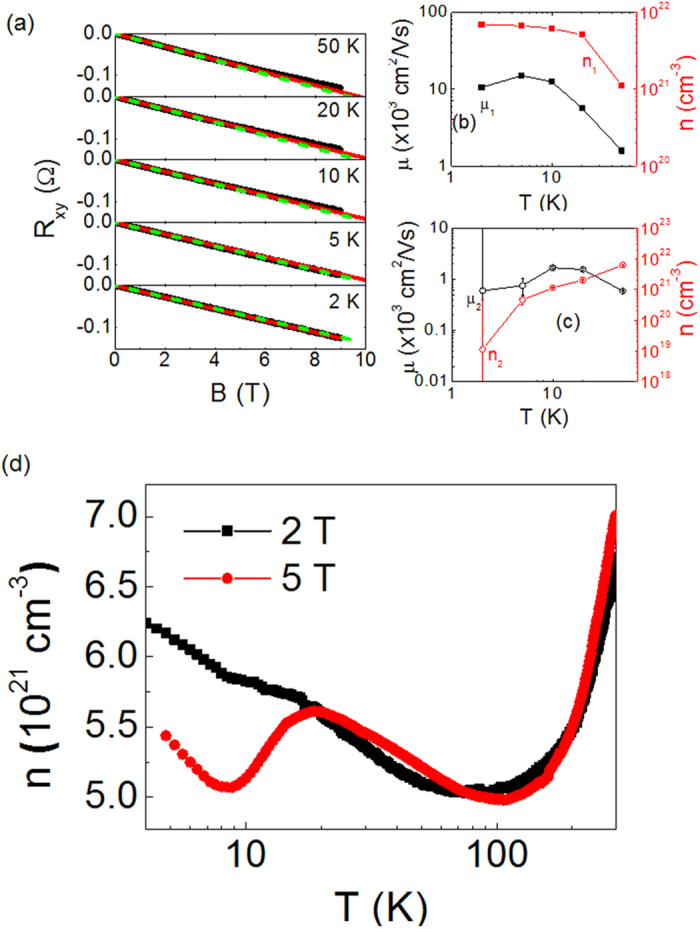
(a) Temperature dependence of Rxy vs. B curve for B// . Black, red solid lines, and green dashed line represent the experimental data, the fitting curve by two-band model, and the linear fitting curve in the range of [0, 2 T], respectively. (b,c) Temperature dependence of carrier density (n) and carrier mobility (μ) of the two bands calculated by fitting to two-band model. Error bars in (c) represent the standard deviation while they are smaller than the size of the symbol in (b). (d) Temperature dependence of n measured with B = ±2 T (black square) and ±5 T (red circle).