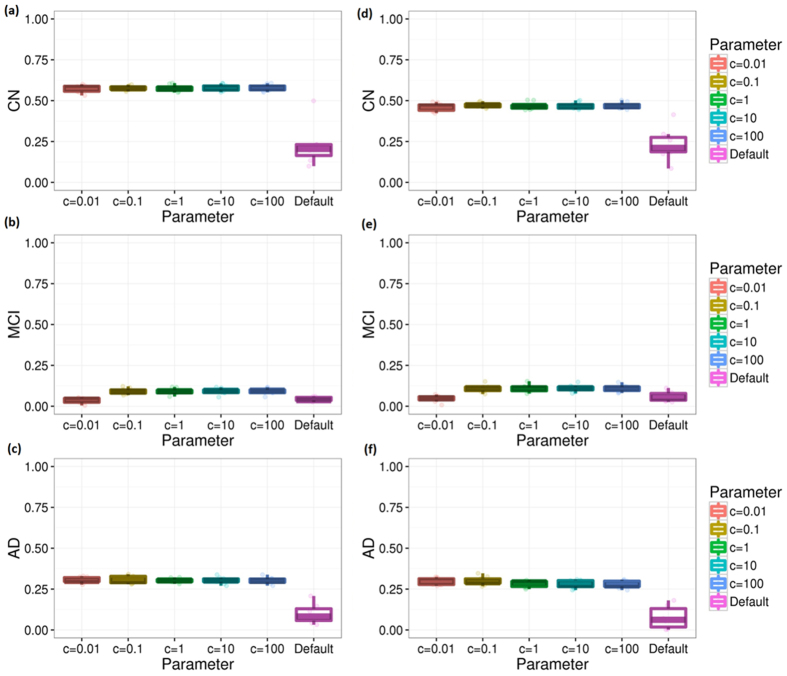
Figure 3. Cross validations for different diagnosis groups without ADNI-MEM and ADNI-EF.
This figure shows the performance of COMPASS method measured by repeating 10-fold computational cross validation 10 times. Subfigures (a–c) are the results measured by Pearson correlation coefficient between the observed and predicted MMSE scores under different parameters. Subfigures (d–f) are the results measured by Spearman’s correlation coefficient.

