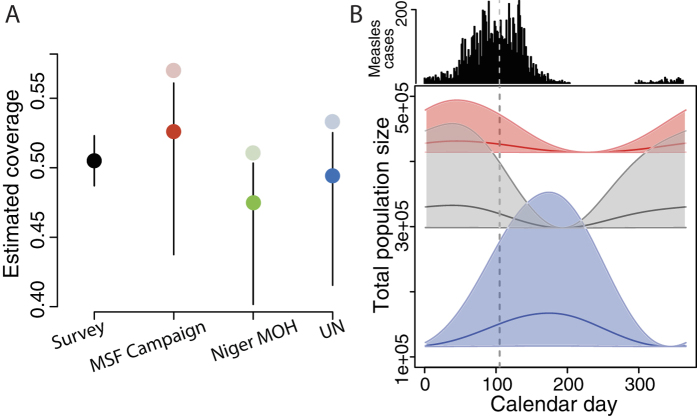
Figure 3. Population fluctuations and vaccine coverage.
. (A) Point estimates of coverage of reinforcement activities in the city from LQAS responses (left, black) and as calculated from doses distributed and city population size estimates from MSF, MoH, and the UN (left to right, faded points). Bright points and CI: Estimated coverage of reinforcement activities with CI including model estimates from posterior distribution of population flux using city population size estimates (bright points and lines). (B) Above: reported daily measles cases in Niamey. Below: estimated population fluxes of each commune by calendar day calculated from model. Vertical dashed line indicates start of reactive immunization campaign. Central solid lines indicate estimates for population flux based on posterior mean; shaded polygons indicate prediction intervals for flux based on central 95% of posterior distribution. Commune colors as in Fig. 1.

