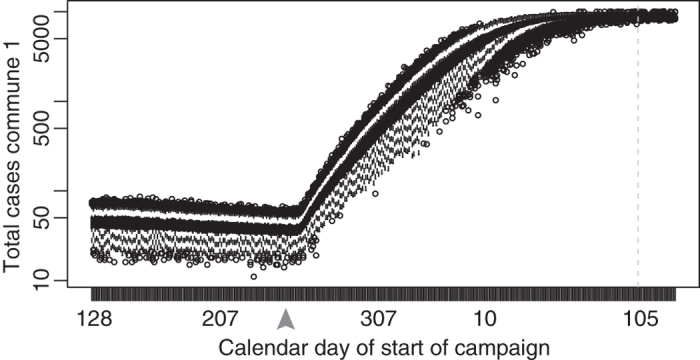
Figure 4. Vaccination time and outbreak size, commune 1, Niamey.

Boxplots of the predicted total size (central 90%) resulting from a measles outbreak if a two-week campaign vaccinating 90% of the population began on the day of the x-axis. The outbreak started on day 307, 2003; the immunization campaign began on day 105 of 2004, shown by the dashed vertical line. A campaign beginning as late as ~day 230 (grey arrow) can theoretically result in a smaller total outbreak size but best practice remains to vaccinate early in response to an outbreak.
