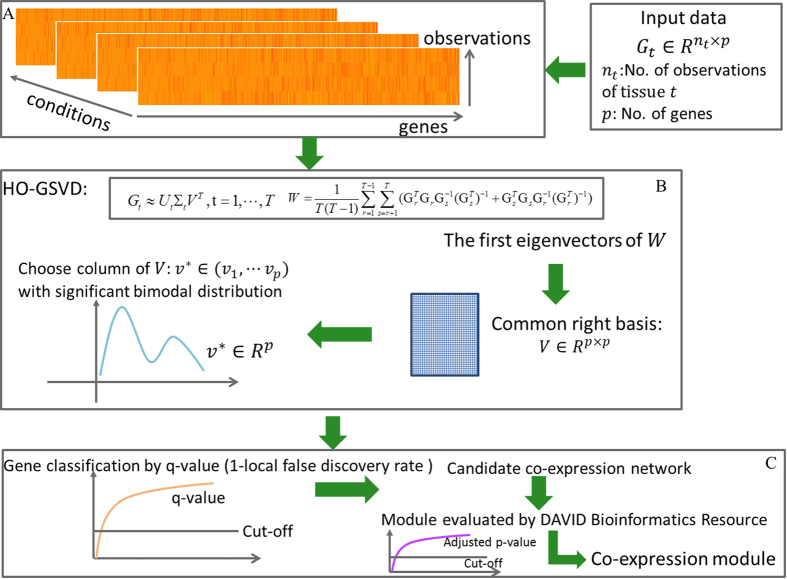
Figure 1. Schematic illustration of the ICEGM.
(A) Gene expressions in different conditions were represented by large-scale matrices with row as samples and column as genes. (B) The multiple matrices were decomposed through HO-GSVD with diverse left basis matrices and diagonal matrices, as well as an identical right basis matrix, and the right basis vector with significant bimodal distribution was calculated. (C) The genes significantly located in the tail area of small weight components of bimodal distribution were selected. The gene modules were then generated through the functional enrichment validation via DAVID bioinformatics software.

