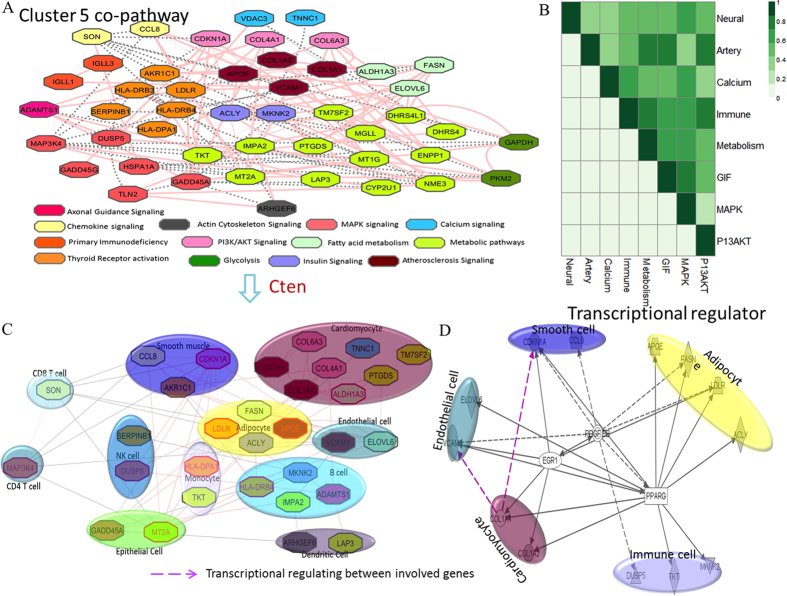
Figure 5. Canonical pathways analysis on the genes associated with inflammation, CVD, and skeletal muscle disorder.
(A) The co-expression networks for genes associated with inflammatory, CVD, and skeletal disorder. Genes are grouped into diverse pathways they involved in as different colors. (B) The correlations among pathways associated with co-expressed inflammatory, CVD, and skeletal disorder genes. The value of correlation coefficient is shown with the corresponding colors. (C) The pathways and cell types lined to those co-expressed inflammatory, CVD, and skeletal disorder genes. (D) The regulators shared by genes in fat, immune, heart, and muscle cell.

