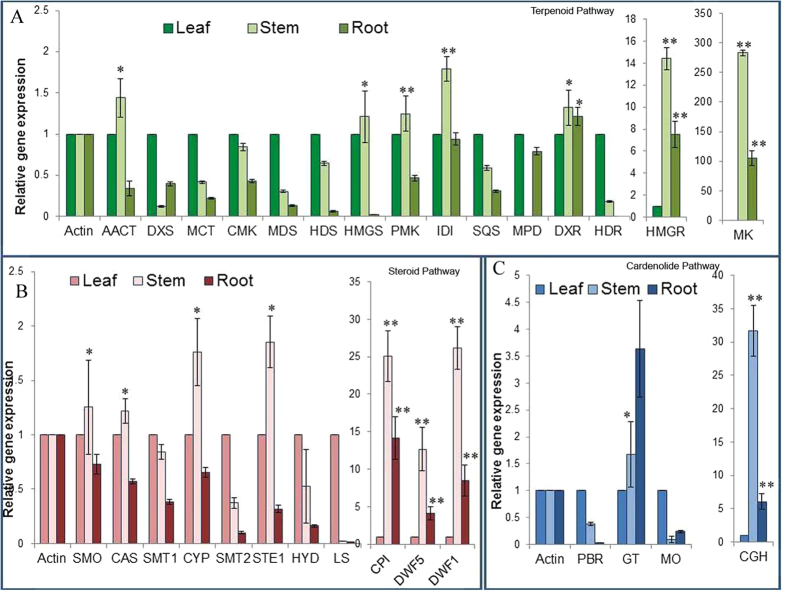
Figure 5.
(A) Tissue specific expression of genes involved in terpenoid backbone biosynthesis by qRT-PCR. (B) Tissue specific expression of genes involved in steroid backbone biosynthesis by qRT-PCR. (C) Tissue specific expression of genes involved in cardenolide biosynthesis by qRT-PCR. The stem and root group compared with leaf group. The data represents three independent biological and experimental repeats with standard deviations. Asterisk *(P < 0.05) and **(P < 0.001) indicate significant differences as determined by Student’s t test. Full names of genes are mentioned in Supplementary Table 4.

