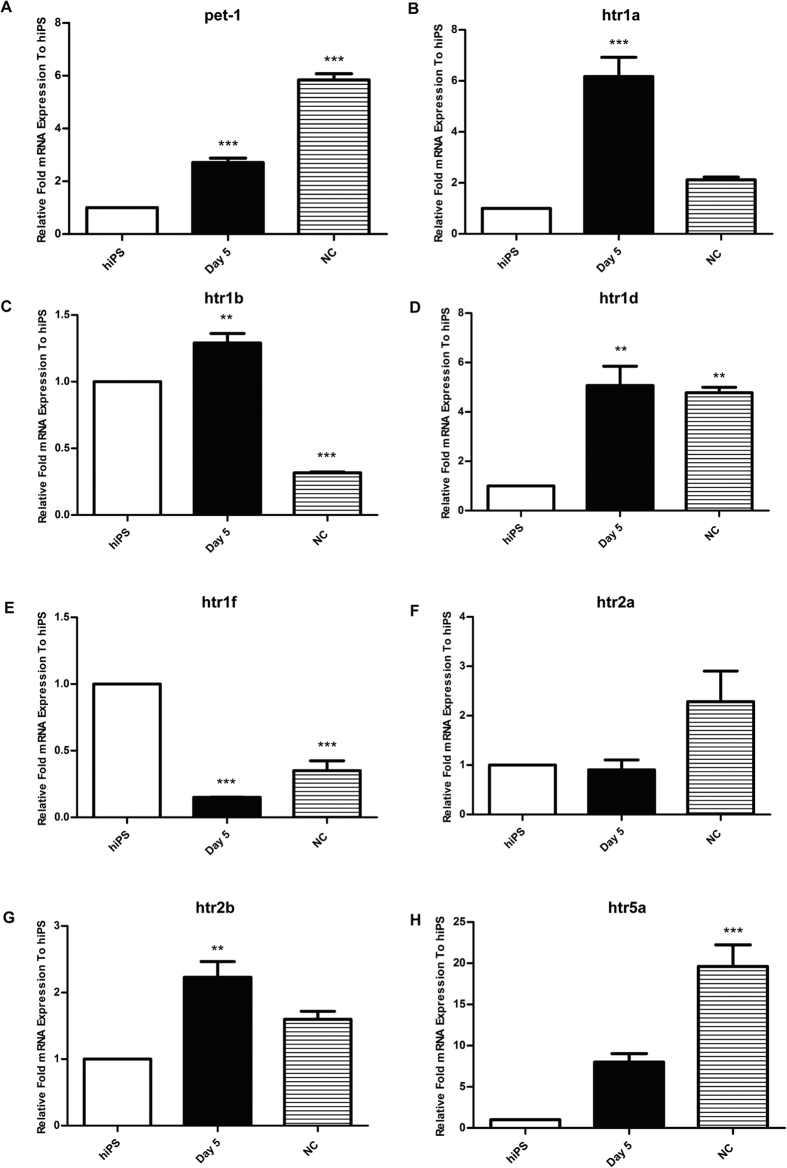
Figure 3. Expression patterns of serotonin receptors from hiPS cells to NC cells.
Normalized expression tested for pet-1 (A), htr1a (B), htr1b (C), htr1d (D), htr1f (E), htr2a (F), htr2b (G) and htr5a (H) by qPCR. ***p < 0.005, **p < 0.01, one-way ANOVA with Tukey’s post-hoc test was used between the hiPS cells group and each time point follow. All error bars show mean ± s.e.m.

