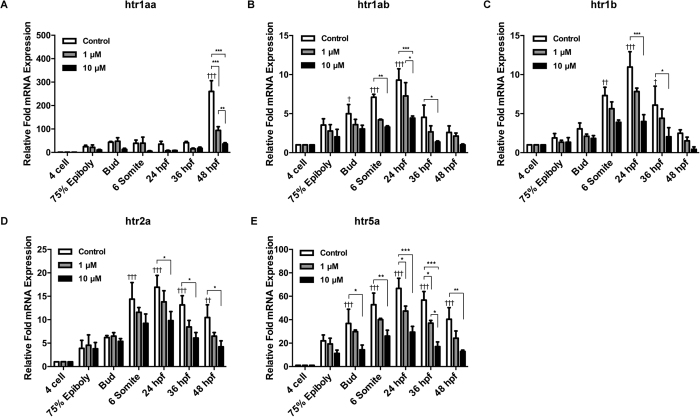
Figure 4. Quantitative changes of the expression of serotonin receptors during the early development of zebrafish embryos under fluoxetine administration.
Real-time PCR was performed to confirm the relative expression level changes of htr1aa (A), htr1ab (B), htr1b (C), htr2a (D) and htr5a (E) with or without the treatment of fluoxetine in two doses. Two-way ANOVA with Tukey’s multiple comparisons test was used for analysis; n ≥ 20 per group, ***p < 0.005, **p < 0.01, *p < 0.05, manes the statistically significance between different doses in each of six time points, †††p < 0.005, ††p < 0.01, †p < 0.05 manes the statistically significance between different time points of control groups. All error bars show mean ± s.e.m.

