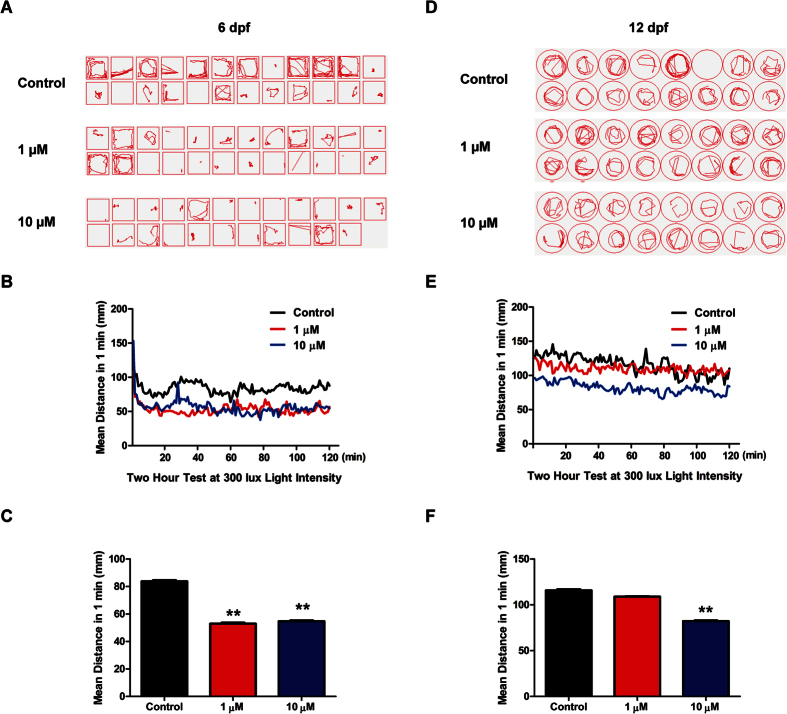
Figure 7. The hypolocomotor behavior of zebrafish larva induced by fluoxetine.
(A,D) Recorded swimming tracks of 3 groups zebrafish. Each red line represents the swimming track of 1 minute recording randomly selected from the 2-hour experiment on both 6 dpf and 12 dpf. (B,E) The locomotor activities of each minute for all zebrafish larva in 3 groups on 6 dpf and 12 dpf. (C,F) The statistic analysis of the average locomotor activities, n ≥ 20 per group, ***p < 0.005, **p < 0.01, *p < 0.05, one-way ANOVA with Tukey’s post-hoc test was used between the control group and each dose fluoxetine group. All error bars show mean ± s.e.m.

