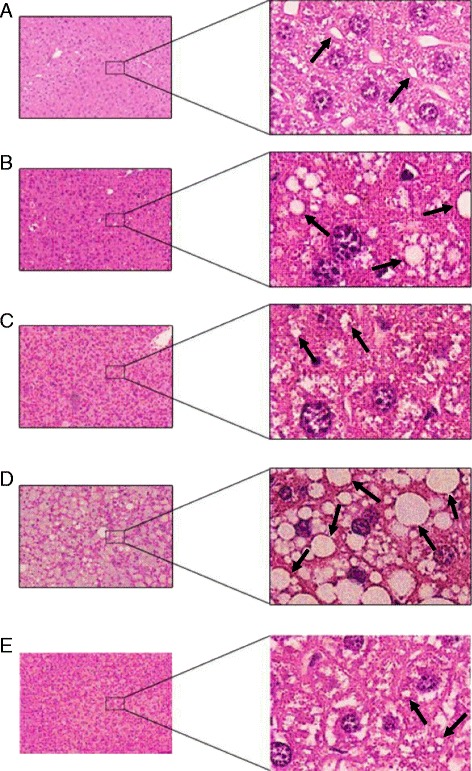
Fig. 2.

Mice liver sections stained with Ehrlich’s hematoxylin and eosin (H&E). The results of staining were viewed with ×4 and ×40 magnifications. Arrows indicate some lipid droplets. Control group fed with a repelletted standard chow (a). CLA mix group fed with a 1 % by weight of a mixture of CLA c9,t11 and CLA t10, c12 isomers (b). CLA c9,t11 group fed with a 1 % by weight of CLA c9,t11 isomer (c). CLA t10, c12 group fed with a 1 % by weight of CLA t10, c12 isomer (d). Linoleic acid group fed with a 1 % by weight of linoleic acid (e)
