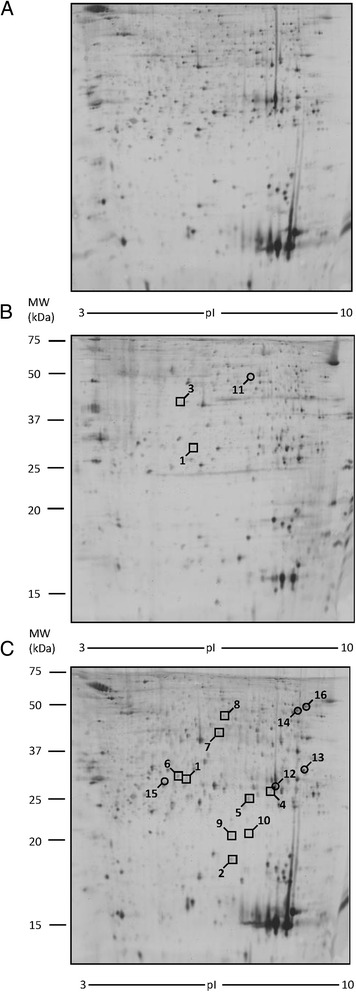
Fig. 6.

2-DE images of proteins differentially expressed in white adipose tissue (WAT). Spot number reflects the number reported in Table 2. Molecular weight (KDa) and isoelectric value (pI) are show on the image. Circles indicate proteins up-regulated, while squares indicate proteins down-regulated in CLA treated sample with respect to control sample. a Control mice. b CLA c9,t11 treated mice. c CLA mix (50:50) treated mice
