Fig. 1.

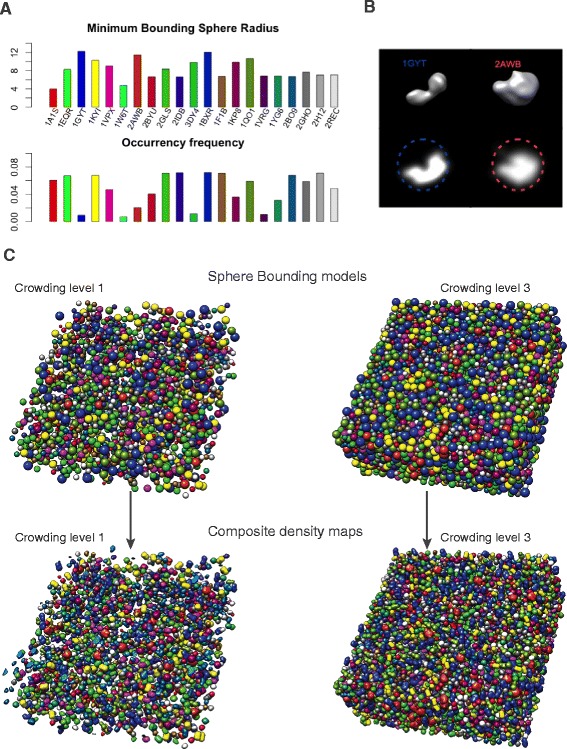
Framework for realistically simulating cryo-electron tomograms of crowded cellular environments. a The minimum bounding sphere radius (upper panel) and frequency (lower panel) for each of the 21 different types of macromolecular complexes in our benchmark set. Shown also are PDB ID of each complex (see Additional file 1: Table S1 for details) [18]. b Isocontour level representation (upper panels) and density plots (lower panels) of two complexes. The minimum bounding sphere of each complex enclosing each complex is also shown. c Crowded mixture of 2000 macromolecular complexes at 11 % (crowding level 1) and of 8000 macromolecular complexes at 44 % (crowding level 3) volume occupancy. Positions of spheres has been randomized and optimized to prevent sphere-sphere overlap. Each bounding sphere has been replaced by the corresponding complex’ randomly oriented density map. The composite density map serves as the input for simulating the cryo electron tomogram
