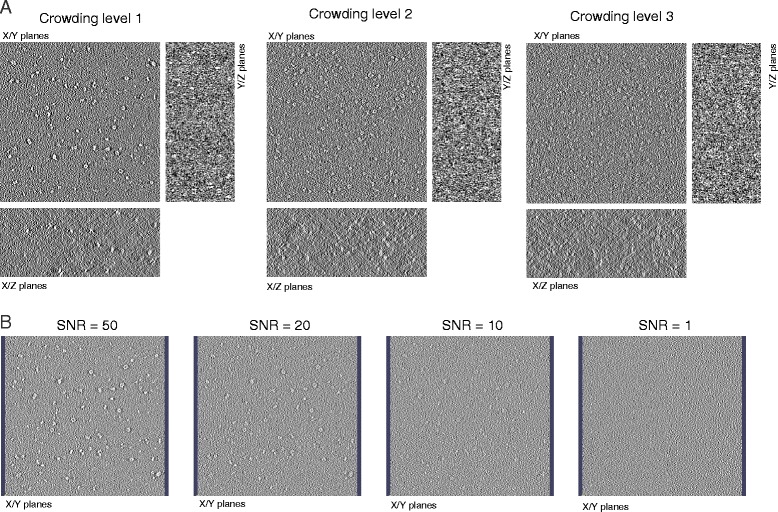
Fig. 2.

Simulated cryo-electron tomograms of crowded cellular environments at varying crowding levels and SNR levels. a XY, XZ, and YZ planes for simulated cryo electron tomograms of macromolecular complex mixtures at three different crowding levels containing 2000, 5000 and 8000 particles, respectively. Tomograms are simulated with a noise level of SNR = 50. b A single XY plane is shown for simulated tomograms with different SNR levels. Tomograms are shown for crowding level 1 containing a total of 2000 complexes
