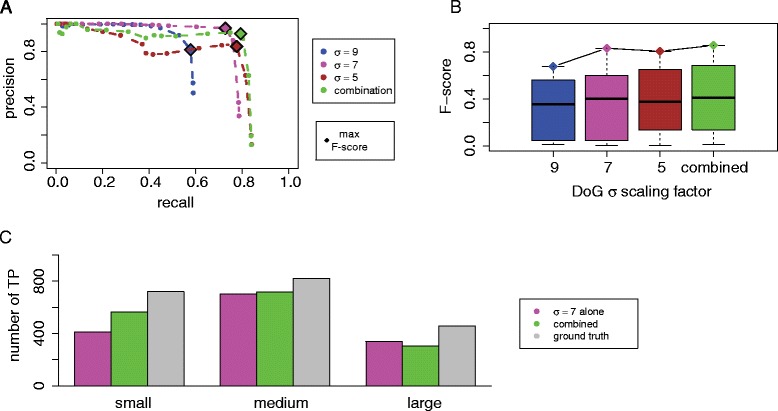
Fig. 5.

Evaluation of combination strategy for particle picking. a Comparison of precision and recall curves when using individual scaling factors or a combination of scaling factors in particle picking for tomograms (crowding level 1, SNR = 50). b Comparison of F-scores for particle picking with individual or a combination of scaling factors. c Comparison of the number of true positives detected in particle picking when using the single optimal scaling factor (σ = 7) and a combination of scaling factors (σ = 7, 5, 9) for complexes of different size. The barplot shows the number of true positives (reliably detected particles) and the ground truth copy numbers for differently sized complexes (small, medium, large)
