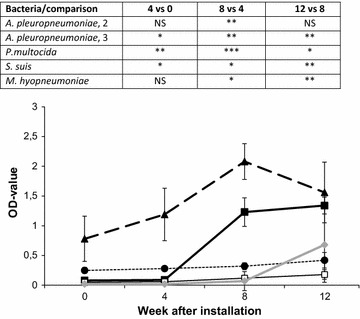
Fig. 4.

Herd C. Serological profile (mean absorbance ± standard deviation) of 12 pigs repeatedly analyzed during the fattening period at a time when pleuritis was registered in 20.5 % of the pigs at slaughter. The figure shows serum levels of antibodies to A. pleuropneumoniae serotype 2 (filled square), serotype 3 (square), P. multocida (filled triangle), S. suis (filled circle) and M. hyopneumoniae (filled diamond). Statistical differences to the previous sampling occasion are visualized at the top of the figure (NS, P > 0.05; *P < 0.05; **P < 0.01; ***P < 0.001)
