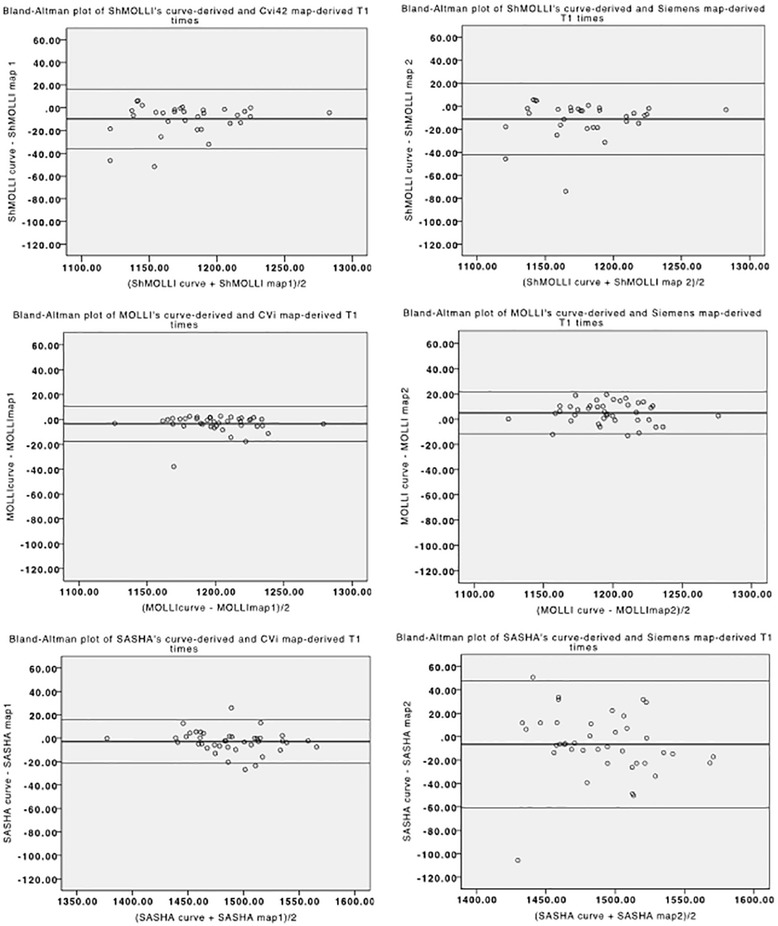
Fig. 5.

Bland-Altman plots of the difference between native T1 measurements using ROI-based and pixel-map based analysis, either generated by offline analysis (left) and inline/scanner-generated analysis (right), for the three sequences. ShMOLLI’s and MOLLI’s graphs are similar, but SASHA’s measurements show a lower dispersion when using the offline maps
