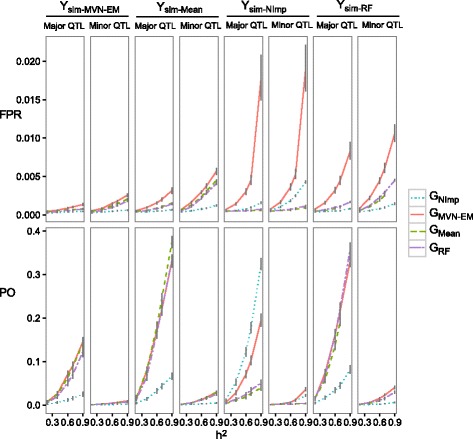
Fig. 3.

Power (PO) and false positives rate (FPR) with 25 QTL, for major and minor QTL for ascertainment bias in imputation performance comparison in barley, with a Bonferroni threshold corrected by the effective number of independent markers. Each parameter was calculated for the combinations of: heritabilties (h 2), marker score matrices to simulate the QTL (i.e. Ysim-NImp, Ysim-MVN-EM, Ysim-Mean and Ysim-RF), and marker score matrices to perform the GWAS analysis (i.e. GNImp, GMVN-EM, GMean and GRF)
