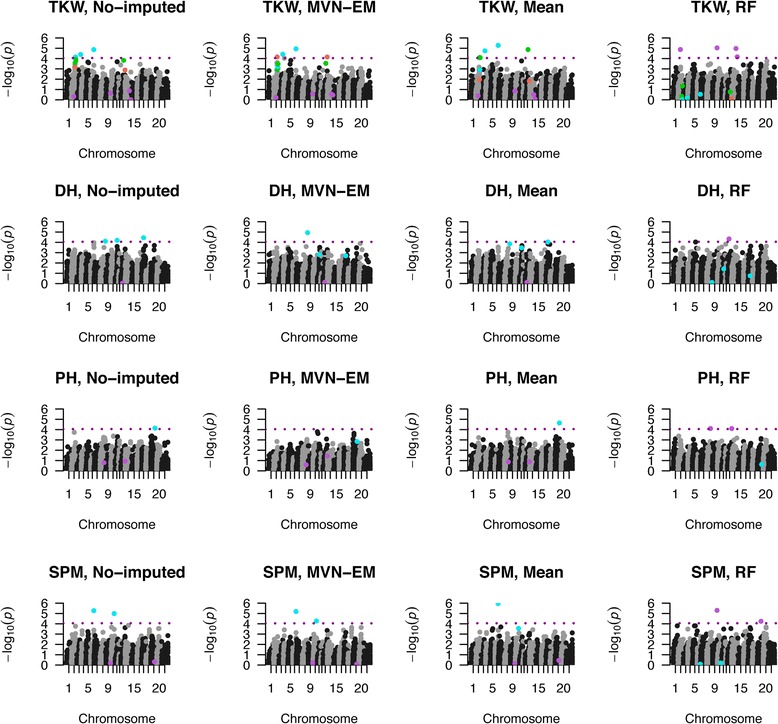
Fig. 6.

Manhattan plots of the GWAS analysis for real phenotype wheat data with 50 % missing rate and a Bonferroni threshold corrected by the effective number of independent markers. For each trait measured and each marker score matrix evaluated, a manhattan plot of the GWAS analysis is presented. The phenotypic traits are: DH, Days to Heading; PH, Plant Height; SPM, Spikes Per Square Meter; TKW, Thousands Kernel Weight. The marker score matrices were: NImp (not imputed), Mean (mean imputed), MVN-EM (Multivariate Normal Expectation Maximization method) and RF (Random Forest method). QTL detected by the NImp matrix are in turquoise, QTL detected exclusively by the MVN-EM matrix are in coral, QTL detected exclusively by the Mean matrix are in green, and QTL detected exclusively by the RF matrix are in orchid
