Fig. 6.

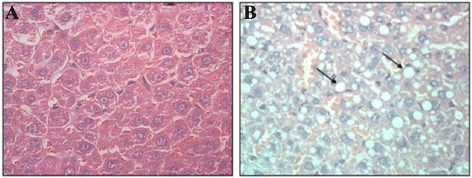
a H&E staining in normal liver (×400); b HE staining in fatty liver (×400), and there was adipose degeneration in liver cells with bright round lipid droplet. The arrow represents liver cells with adipose degeneration

a H&E staining in normal liver (×400); b HE staining in fatty liver (×400), and there was adipose degeneration in liver cells with bright round lipid droplet. The arrow represents liver cells with adipose degeneration