Fig. 1.

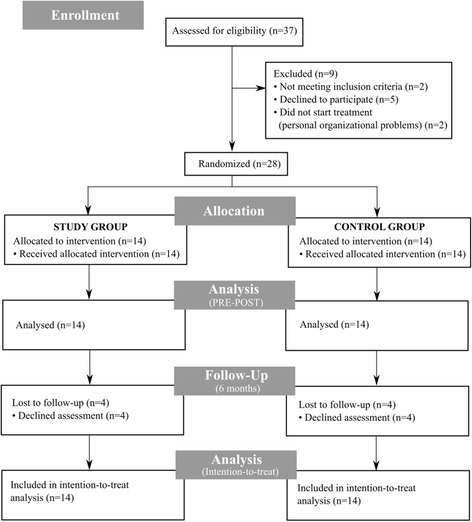
Participants flow diagram. Flowchart illustrating patients’ participation. Number of patients screened, included and considered for analysis is specified. Also, number of and reasons for exclusion and dropout is reported

Participants flow diagram. Flowchart illustrating patients’ participation. Number of patients screened, included and considered for analysis is specified. Also, number of and reasons for exclusion and dropout is reported