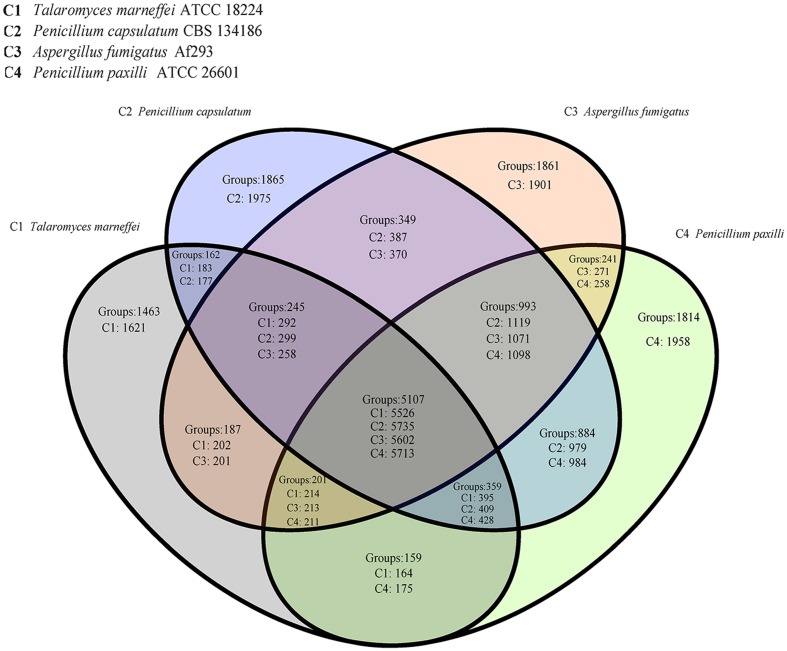
FIGURE 3.
Venn diagram showing shared orthologous groups among genomes of Talaromyces marneffei. P. capsulatum. Aspergillus fumigatus. P. paxilli. The numbers marked behind “Groups” in each region represent for orthologous groups, and the numbers following C1∼C4 means the counts of genes in the strains.

