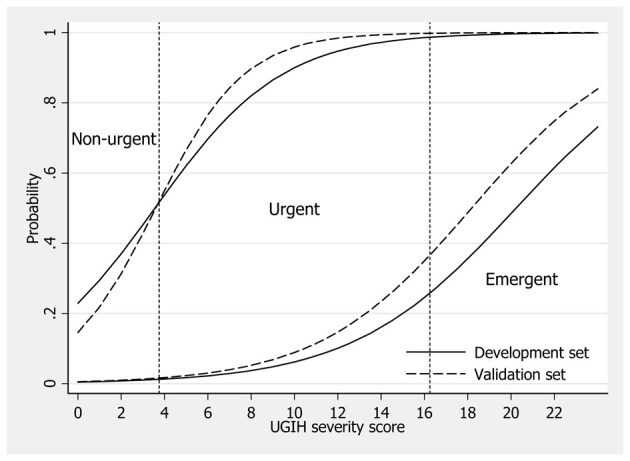
Figure 1.

Score predicted probability of severity/urgency levels in the development data (solid lines) and the validation data (dash lines). Vertical dotted lines represent boundaries (cut-off points) for classifying patients into non-urgent, urgent and emergent groups.
