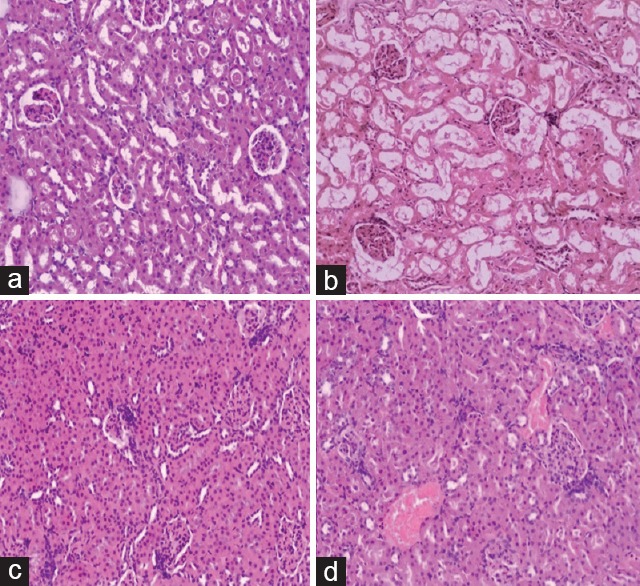
Figure 5.

Histopathology of kidney tissue of normal control, diabetic nephropathy control, and treated groups rats. (a) Section of normal rat kidney tissue showing normal appearance of glomerulus and tubules. (b) Section of diabetic rat kidney tissue showing glomerulosclerosis, tubular degeneration, and mononuclear cell infiltration. (c) Section of diabetic rat kidney tissue treated with mol 5 mg/kg showing moderate glomerular necrosis and mononuclear cell infiltration. (d) Section of diabetic rat kidney tissue treated with mol 10 mg/kg showing no abnormality (×10)
