
Figure 2.
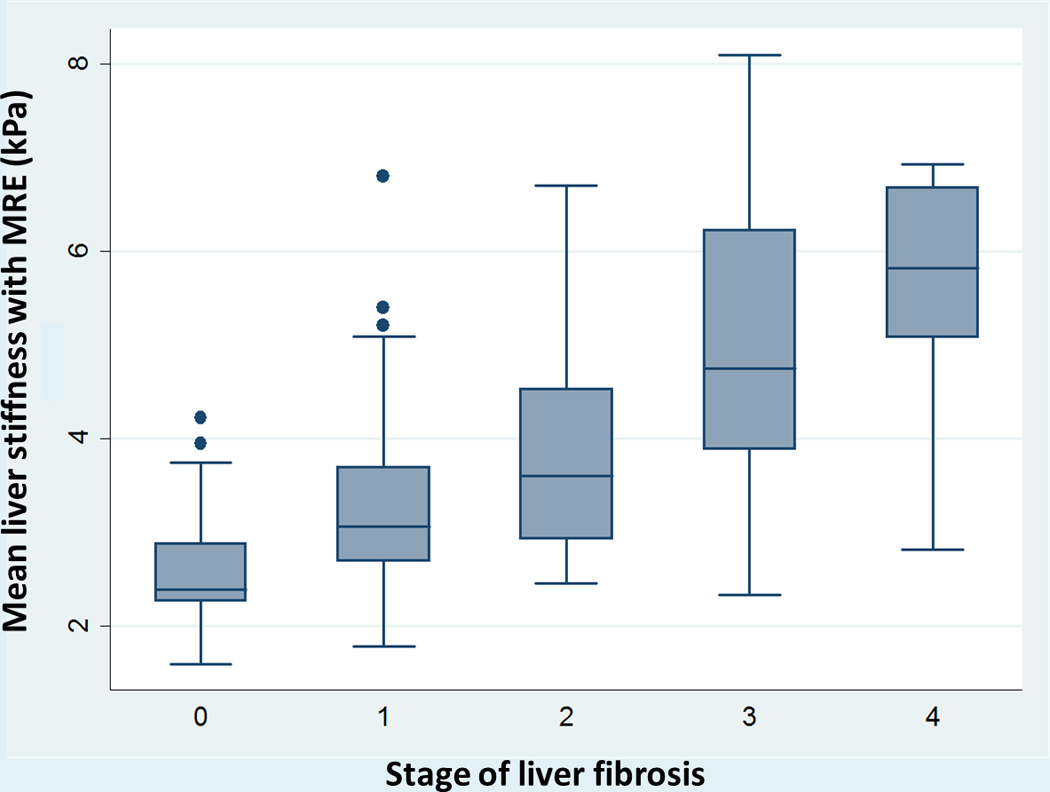
Composite box-plot graph showing magnetic resonance elastography (MRE), stiffness values for various stages of fibrosis. Horizontal line through each box represents a median value and each box top and bottom represent data from the 25th to 75th percentile (middle 50% of observations). Whiskers represent data from minimum to maximum excluding outliers which are represented as separate dots.