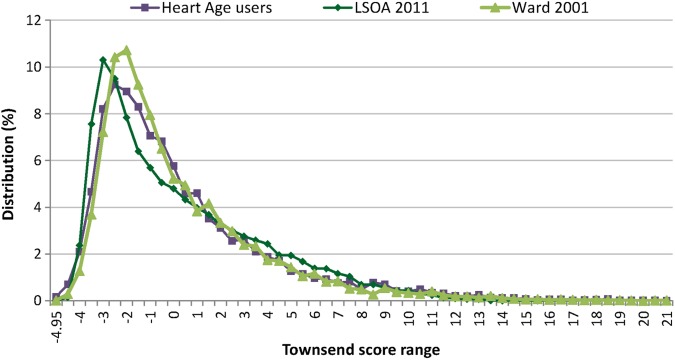
Figure 2.
Townsend profile of heart age tool users showing a similar distribution to that from Census data for England, suggesting good representativeness of the sample covering the full deprivation range. Comparison with lower LSOA based on Census 2011 and with deprivation profile of electoral wards (based on Census 2001). LSOA, layer super output areas.

