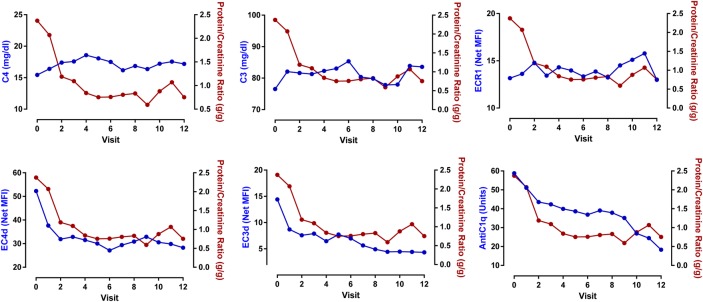
Figure 3.
Change in urinary protein to creatinine ratio (uPCR) as a function of serum C4, C3, anti-C1q, EC4d, EC3d and ECR1. Linear mixed model effects indicated that the decrease in uPCR was associated with an increase in C4 (p=0.004) and C3 level (p=0.004), and ECR1 (p=0.006). Conversely, the decrease in uPCR was associated with a decrease in EC4d (p<0.001) and anti-C1q (p=0.026). Anti-dsDNA (Quanta Lite) and EC3d were not associated with the change in uPCR (p>0.24). Each data point represents the mean at each given study visit.

