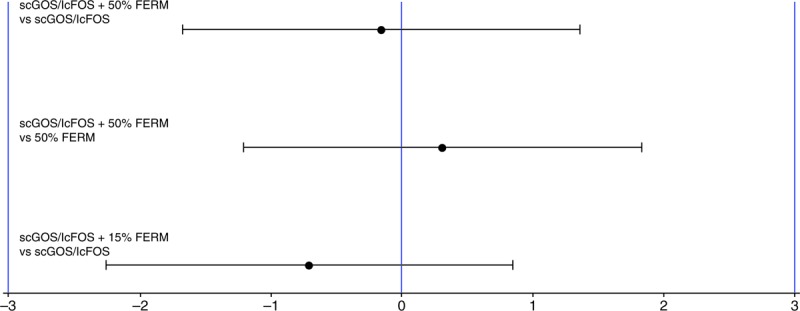
FIGURE 2.

Graphical display of the difference in means of the daily weight gain (g/d) equivalence analysis for the intervention group comparisons of interest. The equivalence analysis was performed using parametric growth curves correcting for sex, site was taken into account as random effect, and each subject's intercept and slope taken into account as random effects. FERM = fermented infant formula; scGOS/lcFOS = short-chain galacto-oligosaccarides and long-chain fructo-oligosaccharides.
