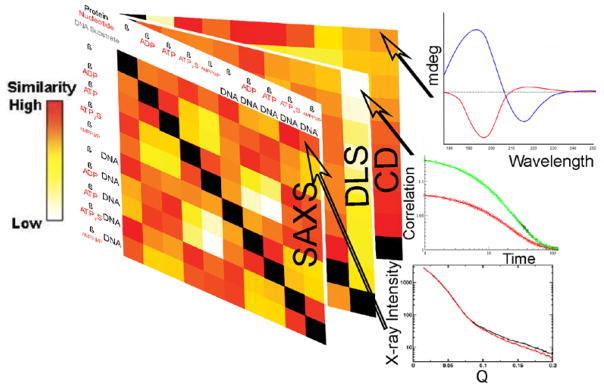
Figure 1. Heatmap comparing pairs of profiles from multiple experimental techniques including SAXS, DLS and CD.
Each cell is a pair wise comparison between a condition or construct. Similarity between SAXS curves is measured by the metric Vr, and displayed as a gradient color where red indicates similarity (low Vr score) and white indicates dissimilarity. The black square diagonals are self-comparisons.

