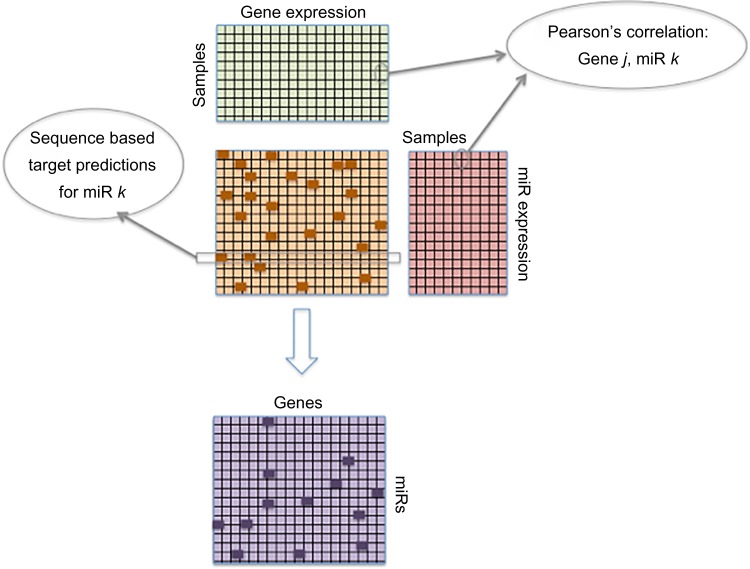
Figure 2.
Inferring MTIs by integrating match miR–gene expression profiles and sequence-based target prediction data. Sequence predicted targets from a pre-selected database (orange matrix) depicted as a binary matrix (indicating the presence or absence of miR–target pairs, as dark orange or light orange boxes, respectively). Expression profiles from matched gene (green matrix) and miR (red matrix) microarrays are correlated using the PCC and input into the purple matrix. MTIs with PCC above a selected threshold and present in the sequence-based target prediction database are indicated as dark purple boxes, while all other pairs as light purple boxes.

