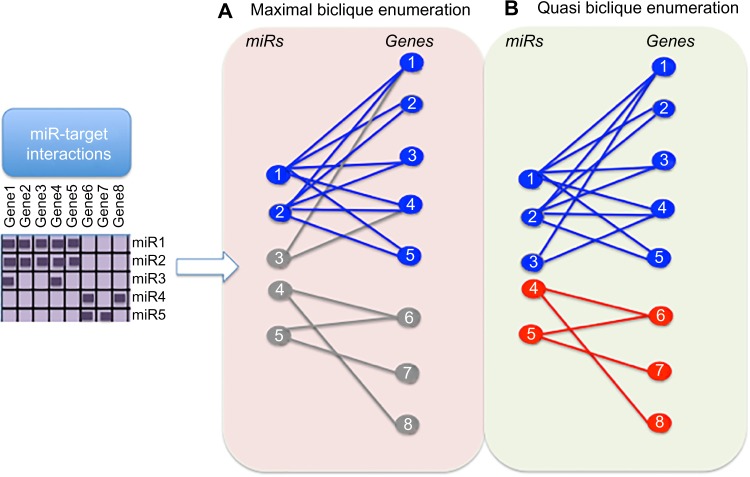
Figure 5.
Comparison of maximal biclique and quasi-biclique enumeration of bipartite graph for identification of MRMs. A matrix of miRs and genes (purple) indicating known MTIs (dark purple boxes) is represented as a bipartite graph with miRs shown as circles on the left (labeled 1–5) and genes shown on the right (labeled 1–8) in a) and b). MTIs are depicted with an edge (straight line) connecting the miR and gene. (A) Maximal biclique enumeration (all-to-all interactions): miRs and genes within a maximal biclique (representing an MRM) are shown in blue, whereas those excluded from a maximal biclique are shown in gray. Unlike miR-1 and miR-2, miR-3 is not connected to all genes within the biclique and is therefore excluded. Likewise, miR 4 and miR 5 do not form a maximal biclique and are excluded. (B) Quasi-biclique enumeration (most-to-most interactions): quasi-biclique enumeration allows some missing interactions within the biclique; therefore, miR-3 is included with miR-1 and miR-2 (blue, above); miR-4 and miR-5 form a biclique (red, below). Thus, in this toy example, quasi-biclique method is more sensitive to detecting MRM than maximal biclique enumeration.

