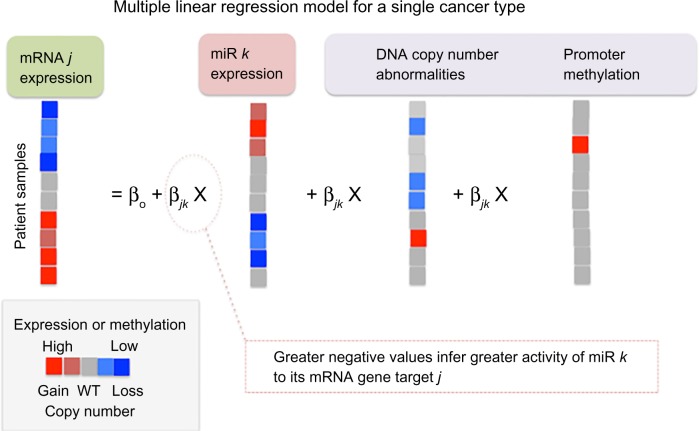
Figure 6.
MLR of mRNA expression in a single-cancer type to identify miR–mRNA associations. mRNA expression from each sample is modeled as the response variable (left), and miR expression, DNA copy number abnormalities (CNA), and level of PM are the independent variables. The MLR evaluates pairwise associations between mRNA j and miR k while controlling for the confounding variables CNA and PM. The greater the negative value of βjk in the MLR, the greater the miR–mRNA association. The degrees of PM and mRNA and miR expression are shown as a heat plot (with increased, unchanged, and decreased levels shown in red, gray, and blue, respectively). CNA are expressed as an increase in the number of copies (gain), no change in copy number (wild type), or loss of copies of the gene, shown in red, gray, and blue, respectively. Modified from Jacobsen et al.8

