Fig. 2.
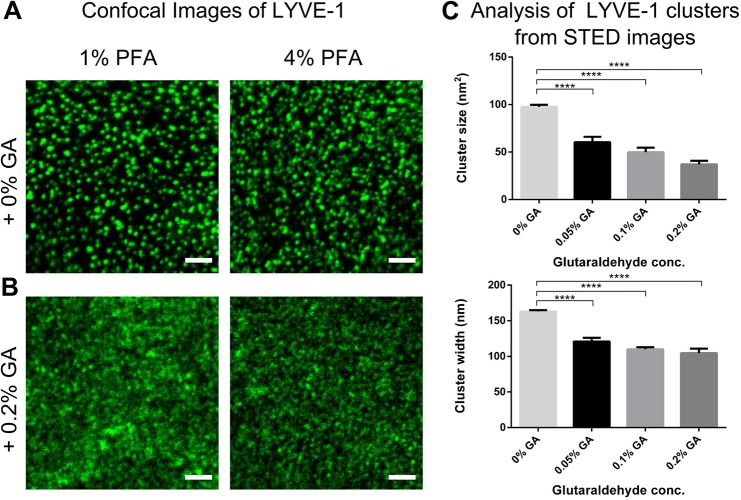
Fluorescence microscopy of LYVE-1 surface distribution in HDLECs using conjugated secondary antibody. Confocal images of LYVE-1 surface distribution in HDLEC visualised with Oregon Green® 488 conjugated secondary antibody (as in Fig. 1E) added after fixation with 1% (w/v) (left panels) and 4% (w/v) PFA (right panels) in (A) the absence and (B) presence of 0.2% (w/v) GA. Scale bars: 5 µm. (C) Analysis of LYVE-1 cluster sizes as imaged by STED microscopy following 1% PFA and GA fixation protocols: cluster size (top) and width (bottom), depicting a reduction in size with increasing in GA concentration. Error bars: mean±s.e.m. Average cluster size and surface area from 10 cells. ****P<0.0001; 1-way ANOVA with Dunnett's multiple comparisons.

